Troubleshooting Akamai CDN using Pragma Headers

Rackspace Cloud Files CDN enabled containers and the Rackspace CDN product can occasionally have an issue, in such cases, you can troubleshoot this a lot easier by using the DEBUG headers. To do this add -D and the folowing -H headers for your output

curl -I http://rackspacecdnurlgoeshereprivatecensored.r17.cf3.rackcdn.com/common/test/generator.png -D - -H "Pragma: akamai-x-get-client-ip, akamai-x-cache-on, akamai-x-cache-remote-on, akamai-x-check-cacheable, akamai-x-get-cache-key, akamai-x-get-extracted-values, akamai-x-get-nonces, akamai-x-get-ssl-client-session-id, akamai-x-get-true-cache-key, akamai-x-serial-no, akamai-x-feo-trace, akamai-x-get-request-id" -L

Naturally for this to work, you need to make sure you have a test URL. You can get one from Cloud Files in the Rackspace Control panel, or from whatever origin is configured with the CDN. Just login to the origin, and find a file path like httpdocs/somefolder/somefile.png and then get the raxcdn.com URL from the Rackspace CDN product page, or the Rackspace Cloud Files ‘show all links’ page on the cog icon next to the cloud files container. And add the path behind your documentroot.

So for the CDN URL rackspacecdnurlgoeshereprivatecensored.r17.cf3.rackcdn.com

For the files on the origin in the documentroot of the website configured with the CDN just add the ‘local’ document path within httpdocs or your www folder!

i.e. rackspacecdnurlgoeshereprivatecensored.r17.cf3.rackcdn.com becomes rackspacecdnurlgoeshereprivatecensored.r17.cf3.rackcdn.com/somefolder/somefile.png

Creating a proper Method of Retrieving, Sorting, and Parsing Rackspace CDN Access Logs

So, this has been rather a bane on the life which is lived as Adam Bull. Basically, a large customer of ours had 50+ CDN’s, and literally hundreds of gigabytes of Log Files. They were all in Rackspace Cloud Files, and the big question was ‘how do I know how busy my CDN is?’.

screen-shot-2016-11-07-at-12-41-30-pm

This is a remarkably good question, because actually, not many tools are provided here, and the customer will, much like on many other CDN services, have to download those logs, and then process them. But that is actually not easier either, and I spent a good few weeks (albeit when I had time), trying to figure out the best way to do this. I dabbled with using tree to display the most commonly used logs, I played with piwik, awstats, and many others such as goaccess, all to no avail, and even used a sophisticated AWK script from our good friends in Operations. No luck, nothing, do not pass go, or collect $200. So, I was actually forced to write something to try and achieve this, from start to finish. There are 3 problems.

1) how to easily obtain .CDN_ACCESS_LOGS from Rackspace Cloud Files to Cloud Server (or remote).
2) how to easily process these logs, in which format.
3) how to easily present these logs, using which application.

The first challenge was actually retrieving the files.

swiftly --verbose --eventlet --concurrency=100 get .CDN_ACCESS_LOGS --all-objects -o ./

Naturally to perform this step above, you will need a working, and setup swiftly environment. If you don’t know what swiftly, is or understand how to set up a swiftly envrionment, please see this article I wrote on the subject of deleting all files with swiftly (The howto explains the environment setup first! Just don’t follow the article to the end, and continue from here, once you’ve setup and installed swiftly)

Fore more info see:
https://community.rackspace.com/products/f/25/t/7190

Processing the Rackspace CDN Logs that we’ve downloaded, and organising them for further log processing
This required a lot more effort, and thought

The below script sits in the same folder as all of the containers

# ls -al 
total 196
drwxrwxr-x 36 root root  4096 Nov  7 12:33 .
drwxr-xr-x  6 root root  4096 Nov  7 12:06 ..
# used by my script
-rw-rw-r--  1 root root  1128 Nov  7 12:06 alldirs.txt

# CDN Log File containers as we downloaded them from swiftly Rackspace Cloud Files (.CDN_ACCESS_LOGS)
drwxrwxr-x  3 root root  4096 Oct 19 11:22 dev.demo.video.cdn..com
drwxrwxr-x  3 root root  4096 Oct 19 11:22 europe.assets.lon.tv
drwxrwxr-x  5 root root  4096 Oct 19 11:22 files.lon.cdn.lon.com
drwxrwxr-x  3 root root  4096 Oct 19 11:23 files.blah.cdn..com
drwxrwxr-x  5 root root  4096 Oct 19 11:24 files.demo.cdn..com
drwxrwxr-x  3 root root  4096 Oct 19 11:25 files.invesco.cdn..com
drwxrwxr-x  3 root root  4096 Oct 19 11:25 files.test.cdn..com
-rw-r--r--  1 root root   561 Nov  7 12:02 generate-report.sh
-rwxr-xr-x  1 root root  1414 Nov  7 12:15 logparser.sh

# Used by my script
drwxr-xr-x  2 root root  4096 Nov  7 12:06 parsed
drwxr-xr-x  2 root root  4096 Nov  7 12:33 parsed-combined
#!/bin/bash

# Author : Adam Bull
# Title: Rackspace CDN Log Parser
# Date: November 7th 2016

echo "Deleting previous jobs"
rm -rf parsed;
rm -rf parsed-combined

ls -ld */ | awk '{print $9}' | grep -v parsed > alldirs.txt


# Create Location for Combined File Listing for CDN LOGS
mkdir parsed

# Create Location for combined CDN or ACCESS LOGS
mkdir parsed-combined

# This just builds a list of the CDN Access Logs
echo "Building list of Downloaded .CDN_ACCESS_LOG Files"
sleep 3
while read m; do
folder=$(echo "$m" | sed 's@/@@g')
echo $folder
        echo "$m" | xargs -i find ./{} -type f -print > "parsed/$folder.log"
done < alldirs.txt

# This part cats the files and uses xargs to produce all the Log oiutput, before cut processing and redirecting to parsed-combined/$folder
echo "Combining .CDN_ACCESS_LOG Files for bulk processing and converting into NCSA format"
sleep 3
while read m; do
folder=$(echo "$m" | sed 's@/@@g')
cat "parsed/$folder.log" | xargs -i zcat {} | cut -d' ' -f1-10  > "parsed-combined/$folder"
done < alldirs.txt


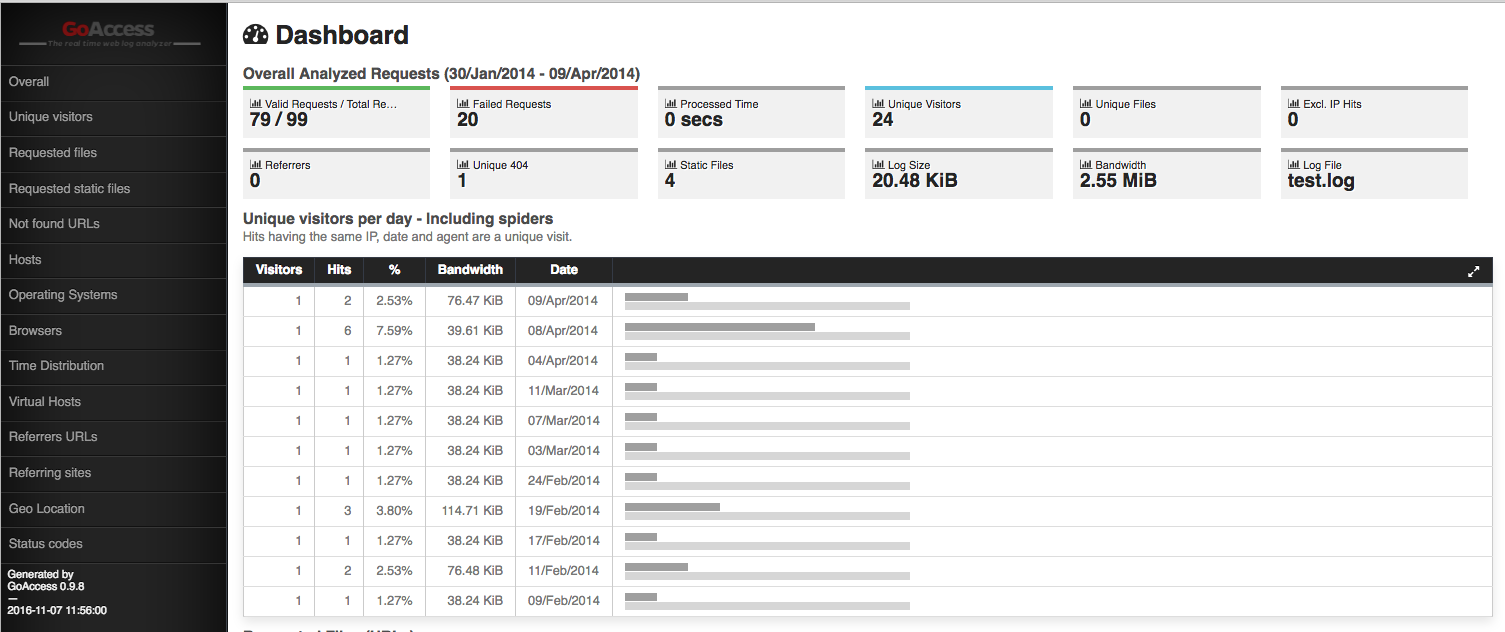
# This part processes the Log files with Goaccess, generating HTML reports
echo "Generating Goaccess HTML Logs"
sleep 3
while read m; do
folder=$(echo "$m" | sed 's@/@@g')
goaccess -f "parsed-combined/$folder" -a -o "/var/www/html/$folder.html"
done < alldirs.txt

How to easily present these logs

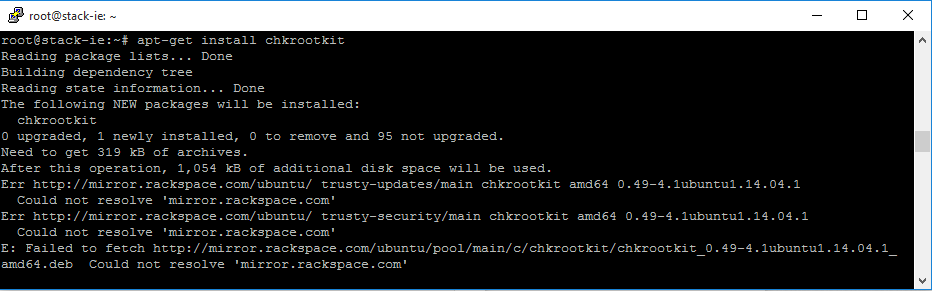
I kind of deceived you with the last step. Actually, because I have already done it, with the above script. Though, you will naturally need to have an httpd installed, and a documentroot in /var/www/html, so make sure you install apache2:

yum install httpd awstats

De de de de de de da! da da!

screen-shot-2016-11-07-at-12-41-30-pm

Some little caveats:

Generating a master index.html file of all the sites


[root@cdn-log-parser-mother html]# pwd
/var/www/html
[root@cdn-log-parser-mother html]# ls -al | awk '{print $9}' | xargs -i echo " {}
" > index.html

I will expand the script to generate this automatically soon, but for now, leaving like this due to time constraints.

Taking strace output from stderr and piping to other utilities

Well, this is a strange thing to do, but say you want to know how fast an application is processing data. how to tell? Enter strace, and… a bit of wc -l with the assistance of tee and 2>&1 proper redirection.

strace -p 9653 2>&1 | tee >(wc -l)

where 9653 is the process id (pid) and wc -l is the command you want to pipe to!

read(4, "2.74.2.34 - - [26/05/2015:15:15"..., 8192) = 8192
read(4, "o) Version/7.1.6 Safari/537.85.1"..., 8192) = 8192
read(4, "ident/6.0)\"\n91.233.154.8 - - [26"..., 8192) = 8192
^C1290

1290 lines in the output.. perfect, thats what I wanted to know, roughly how quickly this log parser is going thru my logs 😀

Adding nodes and Updating nodes behind a Cloud Load Balancer

I have succeeded in putting together a basic script documenting exactly how API works and for adding node(s), listing the nods behind the LB, as well as updating the nodes (such as DRAINING, DISABLED, ENABLED).

Use update node to set one of your nodes to gracefully drain (not accept new connections, wait for present connections to die). Naturally, you will want to put the secondary server in behind the load balancer first, with addnode.sh.

Once new node is added as enabled, set the old node to ‘DRAINING’. This will gracefully switch over the server.

# List Load Balancers

#!/bin/bash

USERNAME='yourmycloudusernamegoeshere'
APIKEY='apikeygoeshere'
LB_ID='157089'
CUSTOMER_ID='10017858'

TOKEN=`curl https://identity.api.rackspacecloud.com/v2.0/tokens -X POST -d '{ "auth":{"RAX-KSKEY:apiKeyCredentials": { "username":"'$USERNAME'", "apiKey": "'$APIKEY'" }} }' -H "Content-type: application/json" |  python -mjson.tool | grep -A5 token | grep id | cut -d '"' -f4`


curl -v -H "X-Auth-Token: $TOKEN" -H "content-type: application/json" -X GET "https://lon.loadbalancers.api.rackspacecloud.com/v1.0/$CUSTOMER_ID/loadbalancers/$LB_ID"

#

# Add Node(s) addnode.sh

#!/bin/bash

USERNAME='yourmycloudusernamegoeshere'
APIKEY='apikeygoeshere'
LB_ID='157089'
CUSTOMER_ID='10017858'

TOKEN=`curl https://identity.api.rackspacecloud.com/v2.0/tokens -X POST -d '{ "auth":{"RAX-KSKEY:apiKeyCredentials": { "username":"'$USERNAME'", "apiKey": "'$APIKEY'" }} }' -H "Content-type: application/json" |  python -mjson.tool | grep -A5 token | grep id | cut -d '"' -f4`

# Add Node
curl -v -H "X-Auth-Token: $TOKEN" -d @addnode.json -H "content-type: application/json" -X POST "https://lon.loadbalancers.api.rackspacecloud.com/v1.0/$CUSTOMER_ID/loadbalancers/$LB_ID/nodes"


## 

For the addnode script you require a file, called addnode.json
that file must contain the snet ip's you wish to add

#
# addnode.json

{"nodes": [
        {
            "address": "10.0.0.1",
            "port": 80,
            "condition": "ENABLED",
            "type":"PRIMARY"
        }
    ]
}

##

##

# updatenode.sh

#!/bin/bash

USERNAME='yourmycloudusernamegoeshere'
APIKEY='apikeygoeshere'
LB_ID='157089'
CUSTOMER_ID='100101010'
NODE_ID=719425

TOKEN=`curl https://identity.api.rackspacecloud.com/v2.0/tokens -X POST -d '{ "auth":{"RAX-KSKEY:apiKeyCredentials": { "username":"'$USERNAME'", "apiKey": "'$APIKEY'" }} }' -H "Content-type: applic

# Update Node

curl -v -H "X-Auth-Token: $TOKEN" -d @updatenode.json -H "content-type: application/json" -X PUT "https://lon.loadbalancers.api.rackspacecloud.com/v1.0/$CUSTOMER_ID/loadbalancers/$LB_ID/nodes/$NODE_ID"

##

##

## updatenode.json

{"node":{
            "condition": "DISABLED",
            "type":"PRIMARY"
        }
}

Naturally, you will be able to change condition to ENABLED, DISABLED, or DRAINING.

I recommend to use DRAINING, since it will gracefully remove the cloud-server, and any existing connections will be waited on, before removing the server from LB.

Could not resolve mirror.rackspace.com

capture-12

So a customer came to me with an issue about not being able to install chkrootkit, due to DNS failure. The customer wasn’t technical and didn’t understand how to fix it. It’s easy to fix, by wiping the resolv.conf nameservers file, and rebuilding it. Takes a few seconds, this should allow you to resolve domains afterwards again.


# Delete resolv.conf

rm /etc/resolv.conf

# Recreate the DNS file with different DNS servers
touch /etc/resolv.conf
echo "nameserver 4.2.2.4" >> /etc/resolv.conf
echo "nameserver 8.8.8.8" >> /etc/resolv.conf

Alternatively you could just open it up for editing with vi or nano.

vi /etc/resolv.conf
nano /etc/resolv.conf 

Automating Backups in Public Cloud using Cloud Files

Hey folks, I know it’s been a little while since I put an article together. However I have been putting together a really article explaining how to write bespoke backup systems for the Rackspace Community. It’s a proof of concept/demonstration/tutorial as opposed to a production application. However people looking to create custom cloud backup scripts may benefit from the experience of reading thru it.

You can see the article at the below URL:

https://community.rackspace.com/products/f/25/t/7857

Testing Rackspace Cloud-server Service-net Connectivity and creating an alarm

So, the last few weeks my colleagues and myself have been noticing that there has been a couple of issues with the cloud-servers servicenet interface. Unfortunately for some customers utilizing dbaas instances this means that their cloud-server will be unable to communicate, often, with their database backend.

The solution is a custom monitoring script that my colleague Marcin has kindly put together for another customer of his own.

The python script that goes on the server:

Create file:

vi /usr/lib/rackspace-monitoring-agent/plugins/servicenet.sh

Paste into file:

#!/bin/bash
#
ping="/usr/bin/ping -W 1 -c 1 -I eth1 -q"

if [ -z $1 ];then
   echo -e "status CRITICAL\nmetric ping_check uint32 1"
   exit 1
else
   $ping $1 &>/dev/null
   if [ "$?" -eq 0 ]; then
      echo -e "status OK\nmetric ping_check uint32 0"
      exit 0
   else
      echo -e "status CRITICAL\nmetric ping_check uint32 1"
      exit 1
   fi
fi

Create an alarm that utilizes the below metric

if (metric["ping_check"] == 1) {
    return new AlarmStatus(CRITICAL, 'what?');
}
if (metric["ping_check"] == 0) {
    return new AlarmStatus(OK, 'eee?');
}

Of course for this to work the primary requirement is a Rackspace Cloud-server and an installation of Rackspace Cloud Monitoring installed on the server already.

Thanks again Marcin, for this golden nugget.

Using Nova and Supernova to manage Firewall IP access lists, automation & more

So, a customer today reached out to us asking if Rackspace provided the entire infrastructure IP address ranges in use on cloud. The answer is, no. However, that doesn’t mean that making your firewall rules, or autoscale automation need to be painful.

In fact, Rackspace Cloud utilizes Openstack which fully supports API calls which will easily be able to provide this detail in just a few simple short steps. To do this you require nova to be installed, this is really relatively easy to install, and instructions for installing it can be found here;

https://support.rackspace.com/how-to/installing-python-novaclient-on-linux-and-mac-os/

Once you have installed nova, it’s simply a case of making sure you set these 4 lines correctly in your .bash_profile

OS_USERNAME=mycloudusernamegoeshere
OS_TENANT_NAME=yourrackspaceaccountnumbergoeshereusuallysomethinglike1010101010
OS_AUTH_SYSTEM=rackspace
OS_PASSWORD=apikeygoeshere
OS_AUTH_URL=https://identity.api.rackspacecloud.com/v2.0/
OS_REGION_NAME=LON
OS_NO_CACHE=1
export OS_USERNAME OS_TENANT_NAME OS_AUTH_SYSTEM OS_PASSWORD OS_AUTH_URL OS_REGION_NAME OS_NO_CACHE

OS_USERNAME is your mycloud login username (normally the primary user).
OS_TENANT_NAME is your Customer ID, it’s the number that appears in the URL of your control panel link, see below picture for illustration

Screen Shot 2016-08-10 at 2.45.05 PM

OS_PASSWORD is a bit misleading, this is actually where your apikey goes , but I think it’s possible to authenticate using your control panel password too, don’t do that for security reasons.

OS_REGION_NAME is pretty self explanatory, this is simply the region that you would like to list cloud-server IP’s in or rather, the region that you wish to perform NOVA API calls.

Making the API call using the nova API wrapper

# supernova lon list --tenant 100010101 --fields accessIPv4,name
[SUPERNOVA] Running nova against lon...
+--------------------------------------+-----------------+-----------+
| ID                                   | accessIPv4      | Name      |
+--------------------------------------+-----------------+-----------+
| 7e5a7f99-60ae-4c28-b2b8              | 1.1.1.1  |  xapp      |
| 94747603-812d-4594-850b              | 1.1.1.1  |   rabbit2   |
| d5b318aa-0fa2-4269-ae00              | 1.1.1.1  |   elastic5  |
| 6c1d8d33-ae5e-44be-b9f0              | 1.1.1.1  | | elastic6  |
| 9f79a7dc-fd19-4f8f-9c26              |1.1.1.1   | | elastic3  |
| 05b1c52b-6ced-4db0-8af2              | 11.1.1.1 | | elastic1  |
| c8302366-f2f9-4c36-8f7a              | 1.1.1.1  | | app5      |
| b159cd07-8e68-49bc-83ee              | 1.1.1.1  | | app6      |
| f1f31eef-97c6-4c68-b01a              | 1.1.1.1  | | ruby1     |
| 64b7f0fd-8f2f-4d5f-8f89              | 1.1.1.1  | | build3    |
| e320c051-b5cf-473a-9f96              | 1.1.1.1  |   mysql2    |
| 4fddd022-59a8-4502-bf6e              | 1.1.1.1  | | mysql1    |
| c9ad6951-f5f9-4351-b31d              | 1.1.1.1  | | worker2   |
+--------------------------------------+-----------------+-----------+

This is pretty useful for managing autoscale permissions if you need to make sure your corporate network can be connected to from your cloud-servers when new cloud-servers with new IP are built out. considerations like this are really important when putting together a solution. The nice thing is the tools are really quite simple and flexible. If I wanted I could have pulled out detail for servicenet instead. I hope this helps make some folks lives a bit easier and works to demystify API to others that haven’t had the opportunity to use it.

You are probably wondering though, what field names can I use? a nova show will reveal this against one of your server UUID’s

# supernova lon show someuuidgoeshere
+-------------------------------------+------------------------------------------------------------------+
| Property                            | Value                                                            |
+-------------------------------------+------------------------------------------------------------------+
| OS-DCF:diskConfig                   | MANUAL                                                           |
| OS-EXT-SRV-ATTR:host                | censored                                                   |
| OS-EXT-SRV-ATTR:hypervisor_hostname | censored                                                 |
| OS-EXT-SRV-ATTR:instance_name       | instance-734834278-sdfdsfds-                   |
| OS-EXT-STS:power_state              | 1                                                                |
| OS-EXT-STS:task_state               | -                                                                |
| OS-EXT-STS:vm_state                 | active                                                           |
| censorednet network                 | censored                                                     |
| accessIPv4                          | censored                                                 |
| accessIPv6                          | censored                      |
| created                             | 2015-12-11T14:12:08Z                                             |
| flavor                              | 15 GB I/O v1 (io1-15)                                            |
| hostId                              | 860...         |
| id                                  | 9f79a7dc-fd19-4f8f-9c26-72a335ed2be8                             |
| image                               | Debian 8 (Jessie) (PVHVM) (cf16c435-7bed-4dc3-b76e-57b09987866d) |
| metadata                            | {"build_config": "", "rax_service_level_automation": "Complete"} |
| name                                | elastic3                                                         |
| private network                     |                                                 |
| progress                            | 100                                                              |
| public network                      |          |
| status                              | ACTIVE                                                           |
| tenant_id                           |                                                    |
| updated                             | 2016-02-27T09:30:20Z                                             |
| user_id                             |                             |
+-------------------------------------+------------------------------------------------------------------+

I censored some of the fields.. but you can see all of the column names, so if you wanted to see metadata and progress only, with the server uuid and server name.


nova list --fields name, metadata, progress

This could be pretty handy for detecting when a process has finished building, or detecting once automation has completed. The possibilities with API are quite endless. API is certainly the future, and, there is no reason why, in the future, people won't be building and deploying websites thru API only, and some sophisticated UI wrapper like NOVA.

Admittedly, this is very far away, but that should be what the future technology will be made of, stuff like LAMBDA, serverless architecture, will be the future.

Simple way to perform a body check on a website

So, I was testing with curl today and I know that it’s possible to direct to /dev/null to suppress the page. But that’s not very handy if you are checking whether html page loads, so I came up with some better body checks to use.

A Basic body check using wc -l to count the lines of the site

 time curl https://www.google.com/ > 1; echo "non zero indicates server up and served content of n lines"; cat 1 | wc -l
  % Total    % Received % Xferd  Average Speed   Time    Time     Time  Current
                                 Dload  Upload   Total   Spent    Left  Speed
100  167k    0  167k    0     0  79771      0 --:--:--  0:00:02 --:--:-- 79756

real	0m2.162s
user	0m0.042s
sys	0m0.126s
non zero indicates server up and served content of n lines
2134

A body check for Google analytics

$ time curl https://www.groundworkjobs.com/ > 1; echo "Checking for google analytics html elements string"; cat 1 | grep "www.google-analytics.com/analytics.js"
  % Total    % Received % Xferd  Average Speed   Time    Time     Time  Current
                                 Dload  Upload   Total   Spent    Left  Speed
100  167k    0  167k    0     0  76143      0 --:--:--  0:00:02 --:--:-- 76152

real	0m2.265s
user	0m0.042s
sys	0m0.133s
Checking for google analytics html elements string
				})(window,document,'script','//www.google-analytics.com/analytics.js','ga');

Such commands might be useful when troubleshooting a cluster for instance, where one server shows more up to date versions, (different number of lines). There’s probably better way to do this with ls and awk and use the html filesize, since number of lines wouldn’t be so accurate.

Check Filesize from request

$ time curl https://www.groundworkjobs.com/ > 1; var=$(ls -al 1 | awk '{print $5}') ; echo "Page size is: $var kB"
  % Total    % Received % Xferd  Average Speed   Time    Time     Time  Current
                                 Dload  Upload   Total   Spent    Left  Speed
100  167k    0  167k    0     0  79467      0 --:--:--  0:00:02 --:--:-- 79461

real	0m2.170s
user	0m0.048s
sys	0m0.111s
Page size is: 171876 kB

Pretty simple.. but you could take the oneliner even further… populate a variable called $var with the filesize using ls and awk , and then use an if statement to check that var is not 0, indicating the page is answering positively, or alternatively not answering at all.

Check Filesize and populate a variable with the filesize, then validate variable

$ time curl https://www.groundworkjobs.com/ > 1; var=$(ls -al 1 | awk '{print $5}') ; echo "Page size is: $var kB"; if [ "$var" -gt 0 ] ; then echo "The filesize was greater than 0, which indicates box is up but may be giving an error page"; fi
  % Total    % Received % Xferd  Average Speed   Time    Time     Time  Current
                                 Dload  Upload   Total   Spent    Left  Speed
100  167k    0  167k    0     0  78915      0 --:--:--  0:00:02 --:--:-- 78950

real	0m2.185s
user	0m0.041s
sys	0m0.132s
Page size is: 171876 kB
The filesize was greater than 0, which indicates box is up but may be giving an error page

The second exercise is not particularly useful or practical as a means of testing, since if the site was timing out the script would take ages to reply and make the whole test pointless, but as a learning exercise being able to assemble one liners on the fly like this is an enjoyable, rewarding and useful investment of time and effort. Understanding such things are the fundamentals of automating tasks. In this case with output filtering, variable creation, and subsequent validation logic. It’s a simple test, but the concept is exactly the same for any advanced automation procedure too.